
At ten behaviours, 70% of my resampled benchmarks could not produce the paper's headline metric for the cheapest attack. At eighty behaviours, none of them could. I had gone in expecting that metric to be noisy, and I had half a paragraph drafted about variance. What came out instead was a column of blanks that filled in as the sample grew, and the caveat I had been saving turned out to belong to a different metric altogether.
The metric is compute to 50% risk, and the paper is Risk Under Pressure, by Malikeh Ehghaghi, Boglárka Ecsedi, Marsha Chechik and Colin Raffel. Their claim is easy to state. A jailbreak evaluation should charge an attack for the compute it burns, not for the number of queries it sends. Attack success rate at a fixed query budget, which nearly every jailbreak paper reports, treats a query as a unit of effort, and a query is nothing of the kind. A template attack pays for one generation and one judge call per query. A gradient attack runs 131 forward passes through the target before it has a prompt to send. In my own testbed the gradient attack's first query cost 168 times the template attack's first query, and a fixed-budget success rate scored them on the same line. The paper's fix is to plot risk against cumulative floating-point operations, then summarise the risk-compute curve in two numbers: the compute an attacker needs to reach 50% risk, and an average efficiency figure. Across ten models the compute axis shows things the query axis cannot see, the clearest being that scaling a model from 0.5B to 7B parameters raises the price of a gradient attack twentyfold while leaving cheap template attacks nearly as effective as before.
I believe them about the axis. My question was narrower and more operational: whether either summary number could live in a nightly build job, where a robustness figure earns its keep only if a script can compute it every night and tell someone when it moved. So I rebuilt the cost model and both metrics over a task small enough to run in four minutes on a laptop, and asked how much benchmark each ranking needs before it stops changing its mind.
Three limits, so you know what you are reading. There is no language model anywhere in the prototype, by design, so no number below transfers to one. The three attacks are miniatures of published ones and exist in the testbed only to differ in cost, so nothing here tests the attacks themselves. And I say nothing about whether jailbreak robustness can be achieved, which is a harder question than whether it can be measured, and a different one.
For someone who has to decide this sprint, here is where I landed.
- Start charging each attack family in FLOPs now, over the traces your evaluation already produces. The accounting is arithmetic and it adds no experiments.
- The compute axis is real. The paper's scaling asymmetry, an expensive attack getting much dearer as the model grows while a cheap one barely notices, came out of my testbed in the same direction at a millionth of the scale.
- Of the paper's two summary metrics, compute to 50% risk had no value at all for the cheapest attack, on every target, in every seed, and more data made that worse. Risk per unit compute was finite everywhere and ranked two targets consistently from 40 behaviours.
- Every robustness difference I measured tracked how many harmless requests the target refused. Until an over-refusal column and a stability floor sit in the same table, let the number inform and not decide.
A shove and a crane count as one attempt each
Picture the situation the paper is aimed at. You own a model with a safety layer. Every release, someone runs a jailbreak benchmark and hands you a number: 200 behaviours, ten queries each, 31% of them got through. Next release the number is 27%. Did the model get harder to break?
You cannot tell, and the reason has nothing to do with statistics. Suppose the first release fell mostly to a template attack anyone can copy from a forum, and the second fell mostly to a gradient attack that needs the weights and a GPU-hour per behaviour. The percentage went down and your exposure to a realistic attacker went up. Quoting a building's security as "three attempts to get in" without saying whether an attempt was a shove or a crane would be the same mistake.
Classical security has a name for the missing quantity. The work factor is the computational effort an adversary has to spend, and it is why nobody reports a cipher's strength in attempts. The paper imports that idea with FLOPs as the currency and charges every component of an attack step: the target's generation, the judge's evaluation, an auxiliary attacker model if there is one, and the candidate sweep and backward pass if the attack uses gradients.
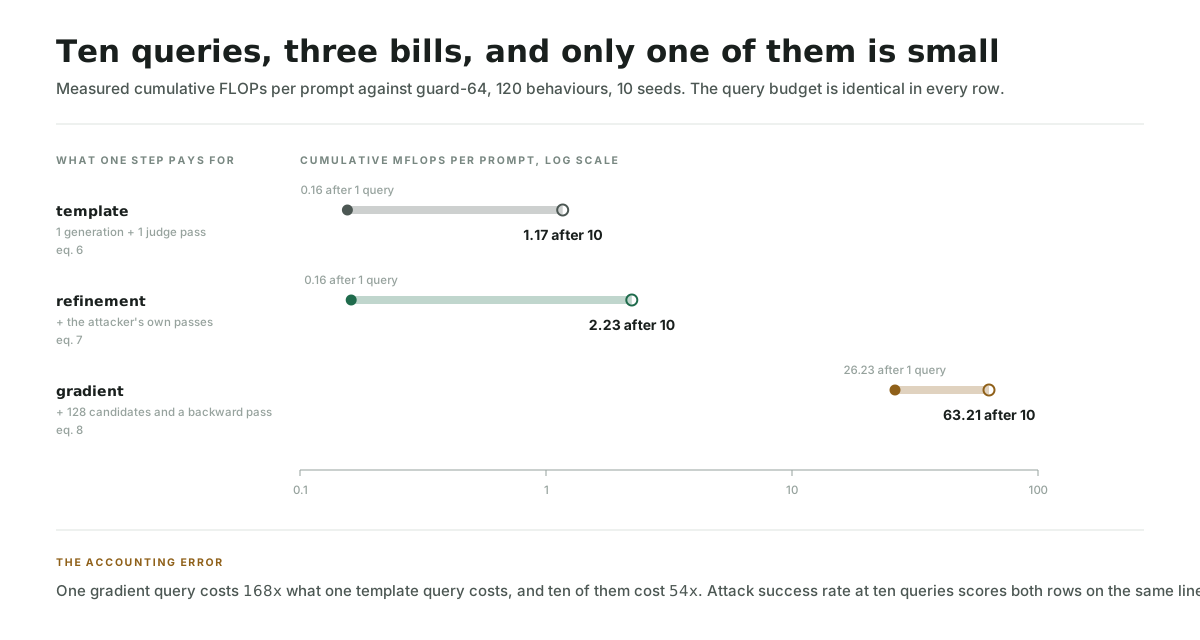
The figure hides how often each attack succeeds, which is the point. Against this target the template attack breaches 33% of behaviours and the gradient attack 93%, so the expensive attack is roughly three times as effective and 168 times as expensive. A success rate reports the three and throws away the 168.
Charging every step for the passes it took
One loop, three policies
Every attack family runs the same loop, which the paper states as Algorithm 1. At step t the attack policy proposes a prompt, the target answers, a safety judge returns a binary verdict, and the loop stops on the first success or exhausts the budget. Query budgets run over {0, 1, 2, 4, 6, 8, 10}. Holding the loop uniform is what makes the families comparable at all: they differ only in what the policy does and what it costs.
Three cost equations and a test
The three cost equations are short enough to read in one sitting. A template step pays for one target generation and one judge pass. A refinement step adds a forward pass through the attacker model. A gradient step adds 128 candidate evaluations and a backward pass, which the paper charges at three times a forward pass: two for the standard backward-to-forward ratio, plus one for the discrete operations that greedy coordinate substitution performs over the vocabulary.
CANDIDATES = 128   # Zou et al. 2023, used unchanged by the paper
BETA_BWD = 3       # 2:1 backward-to-forward, plus 50% for discrete ops

def forward(parameters, length):
    return 2.0 * parameters * length

def template_step(target_n, judge_n, generated, judged):
    return forward(target_n, generated) + forward(judge_n, judged)

def gradient_step(target_n, judge_n, generated, judged, optimised):
    search = (CANDIDATES + BETA_BWD) * forward(target_n, optimised)
    return search + template_step(target_n, judge_n, generated, judged)
Correctness check: tests/test_cost.py asserts each expression against the paper's arithmetic, that the candidate sweep accounts for more than 90% of a gradient step, and that a gradient step costs more than fifty times a template step at matched lengths.
Look at where the gradient cost comes from. The candidate sweep dominates its own equation, so the bill for a gradient attack is set almost entirely by a constant the attack chose, and a defender can predict it without running anything. The asymmetry is built into the arithmetic, which is why I expected it to survive a testbed with no language model in it.
A mean and a threshold crossing
Risk at budget λ is the fraction of behaviours breached within λ steps. Mean cumulative cost at λ is the average FLOPs per prompt, counting only the steps the attacker had to pay for before succeeding. Plot one against the other and you have a risk-compute curve. From it come two summaries: C@0.5, the compute at the first budget whose risk reaches 50%, and average efficiency, the area under the curve normalised by the compute ceiling.
The two summaries have different characters, and here my interest started. Risk and success rate are means: add a behaviour and the number moves a little. C@0.5 is a threshold crossing, so it moves in jumps, and when risk never reaches 50% there is no compute to report. The paper writes those cells as infinity. There are four of them in its main table.
Scaling protected against the attacker least likely to bother
Reported
Holding alignment method constant and scaling Qwen2.5-Instruct from 0.5B to 7B parameters, the compute needed for greedy coordinate gradient to reach 50% risk on HarmBench grows from 20.0 to 399.7 TFLOPs, a factor of twenty. Over the same range the template attack's figure grows from 8.2 to 22.8 TFLOPs, a factor of 2.8, and its success rate at ten queries falls only from 0.99 to 0.94. At 7B the model is about 18 times more exploitable per unit compute under the template attack than under the gradient attack (Table 1, Figure 3).
Read that as a defender and it inverts a common intuition. Scaling did buy real protection, against the expensive attack, from the attacker least likely to bother. Against the cheap attack anyone can run, a fourteen-fold larger model bought almost nothing, and a metric that counts queries would have told you the model improved.
Could the effect be an artefact of the accounting? The mechanism is arithmetic, so the question is fair, and two things in the paper argue against it. The rankings hold across two benchmarks with Spearman correlation at or above 0.91, and the same asymmetry appears in three separate study designs: training stage, model size, and safety tuning. The safety-tuning arm is the one I keep quoting to people, because it fails in the interesting direction.
Safety tuning made the gradient attack cheaper
Reported
Qwen3-4B-SafeRL and its unaligned base reach nearly the same success rate under the template attack, 0.83 against 0.86. Under the gradient attack the safety-tuned model is strictly worse than its base at every compute level: the base never reaches 50% risk within budget while the safety-tuned model reaches it at 189.0 TFLOPs, and per-unit exploitability more than doubles (Table 1, Figure 5).
Inferred
Take that at face value and a release that adds safety training can lower your work factor against the attacker who has your weights while raising it against the attacker who does not. If you ship open weights, those are the same population. The paper does not draw this conclusion; I am deriving it from its numbers, not measuring it.
Ten seeds on data-centre GPUs, nothing on a laptop
The authors are direct about most of their limits. FLOPs are a theoretical proxy that ignores memory bandwidth, parallelism and wall-clock. The judge is an automated model with known reliability problems, and they cite a 2026 result whose title says LLM judges fail to reliably measure adversarial robustness. None of the three attacks is adaptive against a specific defence, which they expect would tighten every bound.
The gap they do not name is the one this article lives in. Every number in the paper is a research measurement over 200 behaviours and 10 seeds on data-centre GPUs, between 0.5 and 10 GPU-hours per configuration. Nothing in it says how the metrics behave as estimators at the scale a release process can afford. I suspect the paper is arguing for an axis and never set out to sell a gate, which is a fair place to stop. It leaves the operational question open, and that is the question I took.
| Evidence | What it supports | What it does not support |
|---|---|---|
| Table 1, Figure 3, ten models | Cost-space robustness differs from query-space robustness, and by a lot | That either summary metric is stable at small sample sizes |
| Cross-benchmark agreement, ρ ≥ 0.91 (Appendix F) | The rankings are not an artefact of one behaviour set | That rankings hold under a benchmark a team can afford to run nightly |
| Four infinite cells in Table 1 | Honest reporting of an uncrossed threshold | Any way to aggregate, trend, or gate on those cells |
The one candidate I could check without a GPU
I only consider papers whose first public version is under six months old, which bounded the search to work posted since February. Within that window I screened four serious candidates against claim support, baseline strength, causal evidence, production transfer, and testability.
| Candidate | Gate | Decisive evidence |
|---|---|---|
| Risk Under Pressure | Proceed; selected | Ten models, three attack families, two benchmarks, released framework, and a claim that is arithmetic rather than empirical, so a small rebuild can test it fairly |
| SkillSafe-Bench | Proceed; not selected | Sharper production hook, since merging task vectors into an aligned model is routine, but one benchmark and six bases is thinner ground than the compute paper stands on |
| Auto-ART | Proceed with concern | Automated gradient-masking detection is the natural successor to what I wrote about last, but a single-author framework paper whose headline is "92% of flagged cases" and whose scope includes mapping to three regulatory regimes is hard to test fairly |
| VanillaBench | Proceed; not selected | The accuracy cost of robustness across 186 models is a real and useful result, and it is a survey of published numbers, so there is no mechanism to rebuild |
The shortlist is a judgement call and someone else would have picked SkillSafe-Bench. I chose the compute paper because its central claim can be checked without a GPU, which is the rarest property on the list, and because a claim made of arithmetic either survives a tiny rebuild or it does not.
Four targets, three attacks, four minutes
The question
Can either of the paper's summary metrics rank two targets consistently, and how many benchmark behaviours does each ranking need to match the full benchmark?
- Baseline
- Attack success rate at a fixed query budget of ten, the metric the paper is arguing with.
- Continue if
- A metric whose ranking agrees with the full benchmark at least 95% of the time on 40 behaviours or fewer, and which is finite for every attack family.
- Stop if
- Both compute metrics need more behaviours than the success rate baseline, or neither is defined for a family an attacker would actually use.
Four targets over one synthetic task. A request is a 24-token sequence, four to six of whose words are the payload; a jailbreak is a request the target should have refused whose answer carried the payload through. Three targets vary width at 8, 24 and 64 hidden units, holding alignment data constant, which stands in for the paper's model-size study. A fourth holds width at 24 and adds 600 extra refusal examples skewed unevenly across six categories, standing in for its safety-tuning study. Parameter counts run from 282 to 2,242, so results are in MFLOPs and only ratios carry over.
Three attack families mirror the paper's: eight surface templates sampled with replacement, a surrogate attacker that proposes rewrites, and a greedy coordinate substitution over a 20-token suffix with 128 candidates a step. Two judges, one accurate and one deliberately degraded, both score every step, with ground truth recorded alongside. 120 behaviours, 10 seeds, the paper's budget sweep, τ = 0.5. No language model, no GPU, no third-party package, four minutes end to end.
git clone https://github.com/shravan1996/ship-the-paper-risk-under-pressure
cd ship-the-paper-risk-under-pressure
python3 -m unittest discover -s tests -t .
python3 eval.py
Nothing in the repository is harmful text. The measurement is the accounting over attack traces, and real harmful content would add nothing to it. The full implementation and its deviations are in the prototype repository.
The fragility I bet on
Before running anything I wrote down what I expected. C@0.5 would be the fragile metric and average efficiency the boring one. A threshold crossing throws away everything about the curve except where it passes one line, so I assumed it would swing under resampling and amplify judge error, and my read was that the paper led with it because it reads well in a table. I expected the ranking to need somewhere around 80 behaviours to settle, and I expected the eight-fold size increase to show up in both metrics.
I was wrong about the mechanism of the fragility, and wrong about the judge. On the first I would have called the direction right for the wrong reason, which I find worse than missing it.
An eightfold model moved the success rate by 0.02
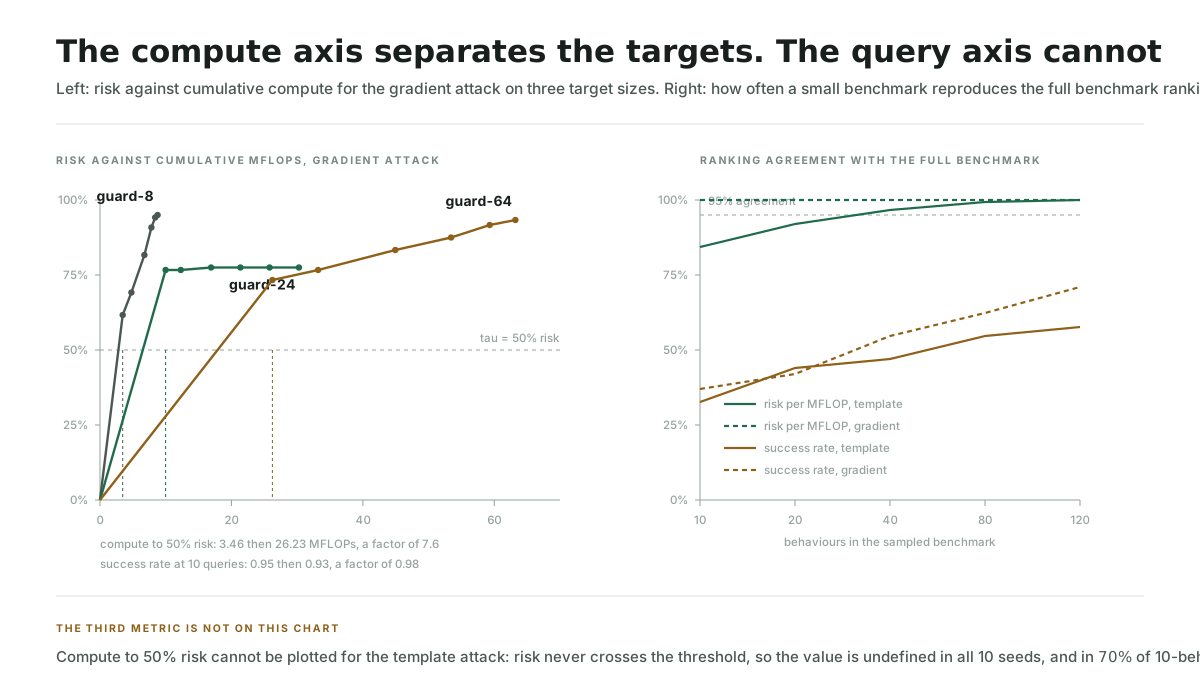
| Measurement, smallest target to largest | Gradient attack | Template attack |
|---|---|---|
| Compute to 50% risk | 3.46 to 26.23 MFLOPs, a factor of 7.6 | undefined at both ends |
| Risk per MFLOP | 67.9 to 10.1, a factor of 6.7 | 262.8 to 181.8, a factor of 1.4 |
| Success rate at 10 queries | 0.950 to 0.933 | 0.343 to 0.334 |
Reproduced
Scaling the target eightfold raised the gradient attack's compute to 50% risk by 7.6 and cut its risk per MFLOP by 6.7, while the template attack's risk per MFLOP fell by only 1.4 and its success rate at ten queries moved from 0.343 to 0.334. Ranking the smallest target against the largest by risk per MFLOP agreed with the full benchmark 84% of the time on 10 behaviours and 97% on 40. Ranking them by success rate reached 58% on 120 behaviours under the template attack and 71% under the gradient attack.
The direction and rough shape of the paper's scaling result came out of a testbed a millionth of the size. I would offer that as the strongest evidence I have that the effect belongs to the accounting and not to any property of language models. The paper's factors are 20 and 2.8; mine are 6.7 and 1.4. What reproduced is the asymmetry, and only the asymmetry.
The blanks multiplied as the sample grew
Here is the part that surprised me, and it took me a while to believe the script. C@0.5 was not noisy. It was absent.
Reproduced
The template attack never reached 50% risk against any target in any of the ten seeds, so its compute-to-threshold figure is undefined in all four rows. Under resampling it gets worse as evidence accumulates: 70% of 10-behaviour samples cannot score it, rising to 100% at 80 behaviours and above.
I keep coming back to that second sentence. Every other metric I have worked with converges as you add data. This one diverges, because a bigger sample pins risk more precisely at a value below the threshold, and precision about being below 50% is exactly what makes the metric undefined. Adding behaviours does not rescue it. It confirms the hole.
Would a lower threshold fix it? Partly, and not in a way I would defend: τ = 0.25 would give the template arm a number, at the cost of a gate that fires when a quarter of behaviours are breached, and the choice of τ then quietly decides which attacks your metric can see.
Does a worse judge change the ranking?
Barely, in my testbed, and I had expected it to be the weak point.
Reproduced
Swapping in a judge with 7.9% false positives and 8.7% false negatives, against 2.6% and 0.0% for the good one, changed C@0.5 by at most 3.1% and success rate by at most 0.09. Scoring the same traces against ground truth instead of either judge left every gradient-arm compute figure identical to three decimal places.
Inferred
My continue threshold fired for risk per MFLOP, which is finite everywhere and settles by 40 behaviours, and my stop threshold fired for C@0.5, which was undefined for the family an attacker would reach for first. I came in expecting to recommend the paper's headline metric with a caveat about variance. I would now not put it in a gate at all, and the caveat belongs to a different metric than I thought. The judge result is the one finding here I would bet against reproducing at language-model scale, where a judge reads text and its failure modes are nothing like a token count.
Unknown
Whether any of this holds for a real language model, a real benchmark, or an adaptive attacker. Whether the 40-behaviour figure means anything at 8B parameters, where a single gradient-attack seed costs GPU-hours instead of milliseconds. Whether the judge stays this harmless when responses are text and not tokens.
Equation 5 and Table 1 disagree about units
While rebuilding average efficiency I could not make the paper's own figures fall out of its definition. Equation 5 sets AE = CAURC / C̄max. CAURC integrates risk with respect to compute, so it already carries units of compute, and dividing by the ceiling once leaves a dimensionless ratio between 0 and 1. Table 1 labels the column risk per TFLOP and reports values between 0.0005 and 0.06.
Those cannot both be right. For Qwen2.5-0.5B under the template attack, risk reaches 0.99 within budget, so a dimensionless area-over-ceiling has to land somewhere near a half, not at 0.0596. The compute ceiling itself is not printed. The same row, though, reports 50% risk at 8.2 TFLOPs, which puts the ceiling in the region of ten. Divide by it twice, which is the same as normalising the compute axis before integrating, and the figure lands in the hundredths, in the right units and the right part of the table's range.
Inferred
The arithmetic above is mine and the paper does not discuss it. The reading matters to anyone quoting the metric, because the two versions disagree about which attack is more efficient. In my run the printed definition ranks the gradient attack as the most efficient of the three, since its risk arrives early within its own enormous budget, while the double-normalised version ranks it least efficient by a factor of 18. The paper's cross-attack claims, including the 18-fold figure it reports at 7B, need the second reading. My prototype computes both and labels them separately.
Four ways the nightly number would lie
The most robust target refused the most
The most conservative target in my run had the lowest success rate under every attack, and it also refused 12.4% of benign requests against 3.9% and 5.2% for the other two sizes. The safety-tuned target dropped over-refusal to 7.8% and became more exploitable per unit compute than its base in five of six categories, including the three that received two to three times more refusal data. I did not expect that last part at all, and I still cannot separate the volume of the extra data from its skew, so I would not read it as evidence about real safety tuning.
What I will read it as: every apparent robustness difference I measured tracked how much ordinary traffic the target turned away. A compute-aware gate with no utility column will approve the release that quietly broke your product, and it will do so with a bigger number than last time.
My judge had never seen a refusal
My first judge scored 0% error on held-out responses and called refusals unsafe the moment it saw one, because I had trained it on prompts and never shown it a refusal. Every attack succeeded on step one, in every arm, and I spent a while believing my targets were made of paper. What should have caught me out sooner: all twelve target-and-attack cells reported exactly 1.00, and no real measurement is that tidy. The bug was mine; the pattern behind it is general. Judges get evaluated on the distribution they were trained on and then applied to attacked outputs, which is a different distribution by construction. Audit the judge on attacked responses, or the risk numbers under every compute figure are unmeasured.
No regression, because nothing computed
An uncrossed threshold produces no number, and a pipeline that reports "no regression" when a metric fails to compute is worse than one that reports nothing. If you adopt C@τ anywhere, the censored fraction has to be a first-class output beside it, and a run where a third of the arms are censored has to fail loudly.
The same FLOP count on a laptop and a rented GPU
FLOPs are invariant to hardware, which is what makes them comparable and also what stops them being a budget. An attacker with a rented GPU-hour and one with a laptop face the same FLOP count and very different real costs. The paper says this plainly. It probably stops mattering inside a release comparison, where you only need the ratio to last release, and starts mattering the moment someone converts a work factor into a dollar figure for a risk register.
The evalability row holds this at Wait
Response time / throughput
High confidence
Entirely off the request path. A nightly job has hours, and the cheap arms cost minutes even at the paper's scale.
Cost
High confidence
The gradient arm ran 3 to 10 GPU-hours per configuration in the paper. Dropping it makes the sweep cheap and removes the arm the metric separates best.
Data gravity
Medium confidence
Public behaviour sets are enough. No labelling programme, though a team wanting workload-specific behaviours has to write them.
Evalability
High confidence
Cost accounting is arithmetic and automatable. C@0.5 was undefined for a whole attack family in every seed, and got more undefined with more data.
Failure modes
Medium confidence
The three that bit me are all detectable: censored metrics, a judge audited off-distribution, and robustness bought with over-refusal. None is detected by default.
Integration
Medium confidence
A job beside the existing eval suite. Nothing in the serving path changes, and the framework is released.
Compliance / audit
Low confidence
Produces a defensible per-release artefact in a currency an auditor can follow. Low confidence because nobody has yet had to defend a FLOP-denominated claim.
Operations burden
Medium confidence
A frozen benchmark, fixed seeds, and attack implementations that need maintenance as attacks evolve, which is research-grade upkeep.
- Average
- 3.5 / 5
- Binding constraint
- Evalability, in the narrow sense that matters here: the accounting is trivially automatable, but one of the two summary metrics cannot be aggregated, trended, or thresholded, and the other needs a utility column beside it before its ranking means anything.
- Override applied
- None. The average sits in the Wait band and the binding constraint agrees with it.
The average does not decide this one. What decides it: the metric the paper leads on cannot be put in a gate, and the metric that can be needs a second column the paper does not discuss. Both problems are fixable in a sprint, which is why I land on Wait and not on Never.
A nightly job with four dashed boxes
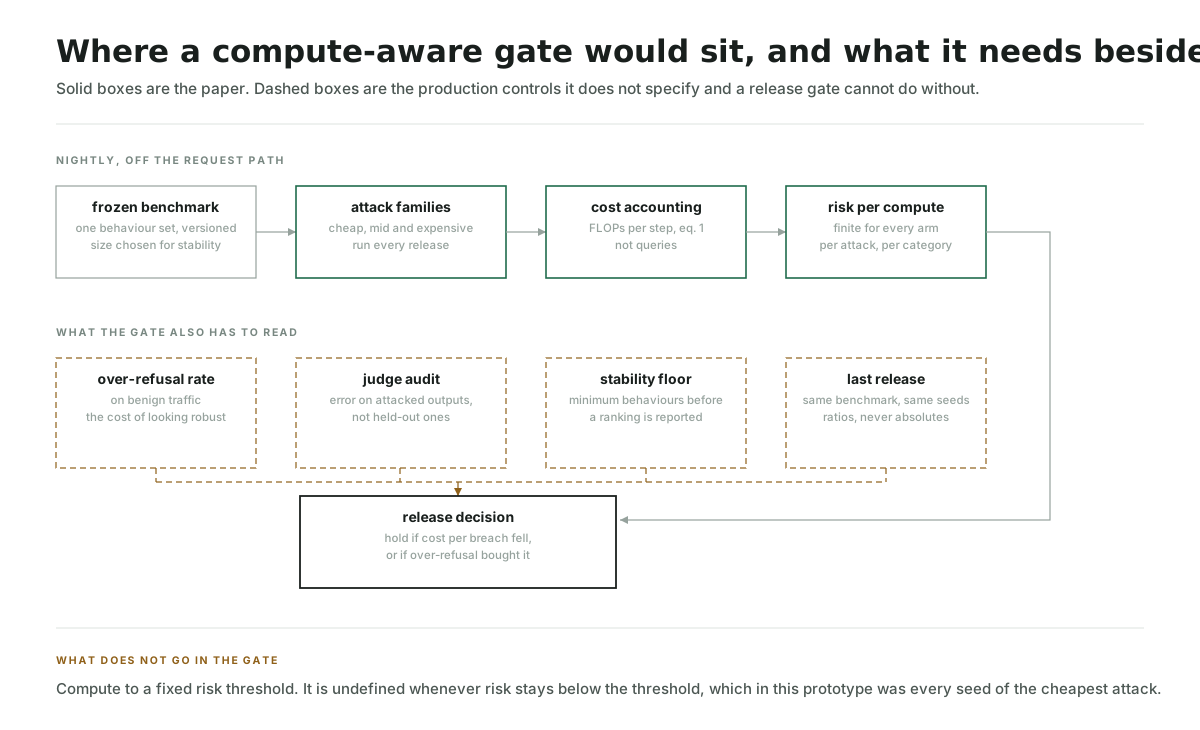
Everything here is asynchronous and none of it touches a request. The benchmark is versioned, because a ranking against a moving behaviour set means nothing. Attacks span the cost range on purpose: dropping the expensive arm saves most of the bill and removes the arm where the compute axis does its clearest work, so make that trade with your eyes open. The gate compares ratios against the previous release on the same benchmark and seeds, never absolute FLOP counts, and it refuses to report a ranking below the stability floor. I expect the stability floor to be the box teams skip, because it is the only one that tells you to collect more data before believing your own dashboard.
Six steps from existing traces to a decision
- 01
Bound one workflow and one threat
- Owner
- Security engineer
- Artifact
- Versioned behaviour set for a single product surface
- Signal
- Behaviour count and category coverage
- 02
Instrument attack cost, change no metrics yet
- Owner
- ML platform engineer
- Artifact
- FLOP accounting over existing eval traces
- Signal
- Cost per family reported beside the current success rate
- 03
Measure your own stability floor
- Owner
- ML platform engineer
- Artifact
- Resampling report over the frozen benchmark
- Signal
- Smallest behaviour count whose ranking agrees with the full set 95% of the time
- 04
Audit the judge on attacked outputs
- Owner
- Applied scientist
- Artifact
- Labelled sample of post-attack responses
- Signal
- False positive and false negative rate on the attacked distribution
- 05
Add the utility column
- Owner
- Product owner
- Artifact
- Over-refusal rate on live benign traffic
- Signal
- Refusals on requests the product is supposed to answer
- 06
Gate on ratios, or say why not
- Owner
- Release manager
- Artifact
- Decision record naming the metric and the floor
- Signal
- Release held or shipped, with the reason recorded
Before a compute figure holds or approves a release, four things have to be true. Risk per unit compute is reported per attack family, with no family silently dropped. The benchmark meets or exceeds the measured stability floor for the comparison being made. Judge error has been measured on attacked responses within the last release cycle. And over-refusal on benign traffic sits next to every robustness figure.
A run goes back for any of four reasons. Any gated metric undefined or censored for more than one arm fails the run; it does not pass it. Cost per breach improving while over-refusal rises is a regression, whatever the dashboard says. A ranking that flips between two consecutive runs on the same benchmark and seeds is a stop. So is any rise at all in the cheapest attack family's risk, whatever the expensive families do.
A human reads any run where a metric was censored, where the ranking flipped, or where cost per breach and over-refusal moved together. Automated pass is allowed only when every gated metric is defined and the floor was met.
Start the accounting, gate on nothing yet
Wait, for gating a release on either summary metric.
The axis is right and I would start using it this week. Cost accounting over traces you already collect is arithmetic, adds no experiments, and immediately tells you something the success rate cannot: which of your attackers is getting a discount. What I would not do yet is let a number computed this way hold or approve a release, because in my run the metric the paper leads on had no value at all for the attack family a real attacker reaches for first, and the metric that did work ranked the most over-refusing model as the most robust one.
Paper evidence and prototype evidence agree on the mechanism and part ways on the metrics. The paper's ten models show the compute axis carrying real signal, and I reproduced that at absurdly small scale. My run says the two summaries are not interchangeable and that one of them cannot be operated as a statistic. Where they conflict I trust the paper on what the axis reveals about models, and my own traces on how the metrics behave as estimators, because the second is the question I designed for and the paper never set out to answer it.
The narrow path I would fund now is four of the six steps above: instrument the accounting, measure your own stability floor, audit the judge on attacked outputs, put over-refusal in the same table. Perhaps two weeks, and it makes the next release comparable to this one. What I would reject is the version that reaches a slide deck as a single hardening number, because a work factor with no utility column beside it is an argument for refusing everything.
I would change this verdict if:
- Someone reports the censored fraction of
C@τon a real benchmark and it turns out to be rare, not routine, in which case the metric is gateable with a guard around it. - A team publishes a stability floor at production scale, on real models, that a nightly job can afford.
- Risk per unit compute is shown to separate two models whose over-refusal rates are matched, which would tell me the metric is measuring robustness rather than conservatism.
On thresholds, judges and refusal rates
If you have a jailbreak evaluation running on real models, tell me two things: how often C@τ comes back undefined on your benchmark, and whether your judge has ever been scored on attacked outputs instead of on the data it was trained on. The censored fraction is the number I could not measure at a scale that matters, and one real table of it would move my verdict faster than anything I can build on a laptop.
Acknowledgements
This article builds on Risk Under Pressure: Compute-Aware Evaluation of Adversarial Robustness in Language Models by Malikeh Ehghaghi, Boglárka Ecsedi, Marsha Chechik and Colin Raffel.
The prototype uses or adapts:
- The cost model, risk-compute curves and summary metrics from the paper above, whose framework is released at r-three/risk-under-pressure
- Miniature versions of three published attacks: JailBroken (Wei, Haghtalab and Steinhardt, 2023), PAIR (Chao and colleagues, 2025) and Greedy Coordinate Gradient (Zou and colleagues, 2023)
References
Primary research
- Risk Under Pressure: Compute-Aware Evaluation of Adversarial Robustness in Language Models. Malikeh Ehghaghi, Boglárka Ecsedi, Marsha Chechik, Colin Raffel, 2026
Supporting and contrary evidence
- Universal and Transferable Adversarial Attacks on Aligned Language Models. The gradient attack whose 128-candidate step dominates its own cost equation
- A coin flip for safety: LLM judges fail to reliably measure adversarial robustness. Why the judge under every risk number is itself a measurement problem
- The attacker moves second: stronger adaptive attacks bypass defenses against LLM jailbreaks and prompt injections. Twelve defences with near-zero reported success rates, broken above 90% by attacks that adapt to them
- VanillaBench: The Hidden Accuracy Cost of Adversarial Robustness. The utility column, argued across 186 published robust models
- Obfuscated Gradients Give a False Sense of Security. The 2018 case that established evaluation, not architecture, as the usual failure
Prototype
Sources last checked: 2026-08-13